Trading Journal PRO
With our Trading Journal PRO, you receive additional professional features for your trading diary
Main Features
- Obtain new, extremely valuable insights and analyses of your trading with the most sophisticated reports.
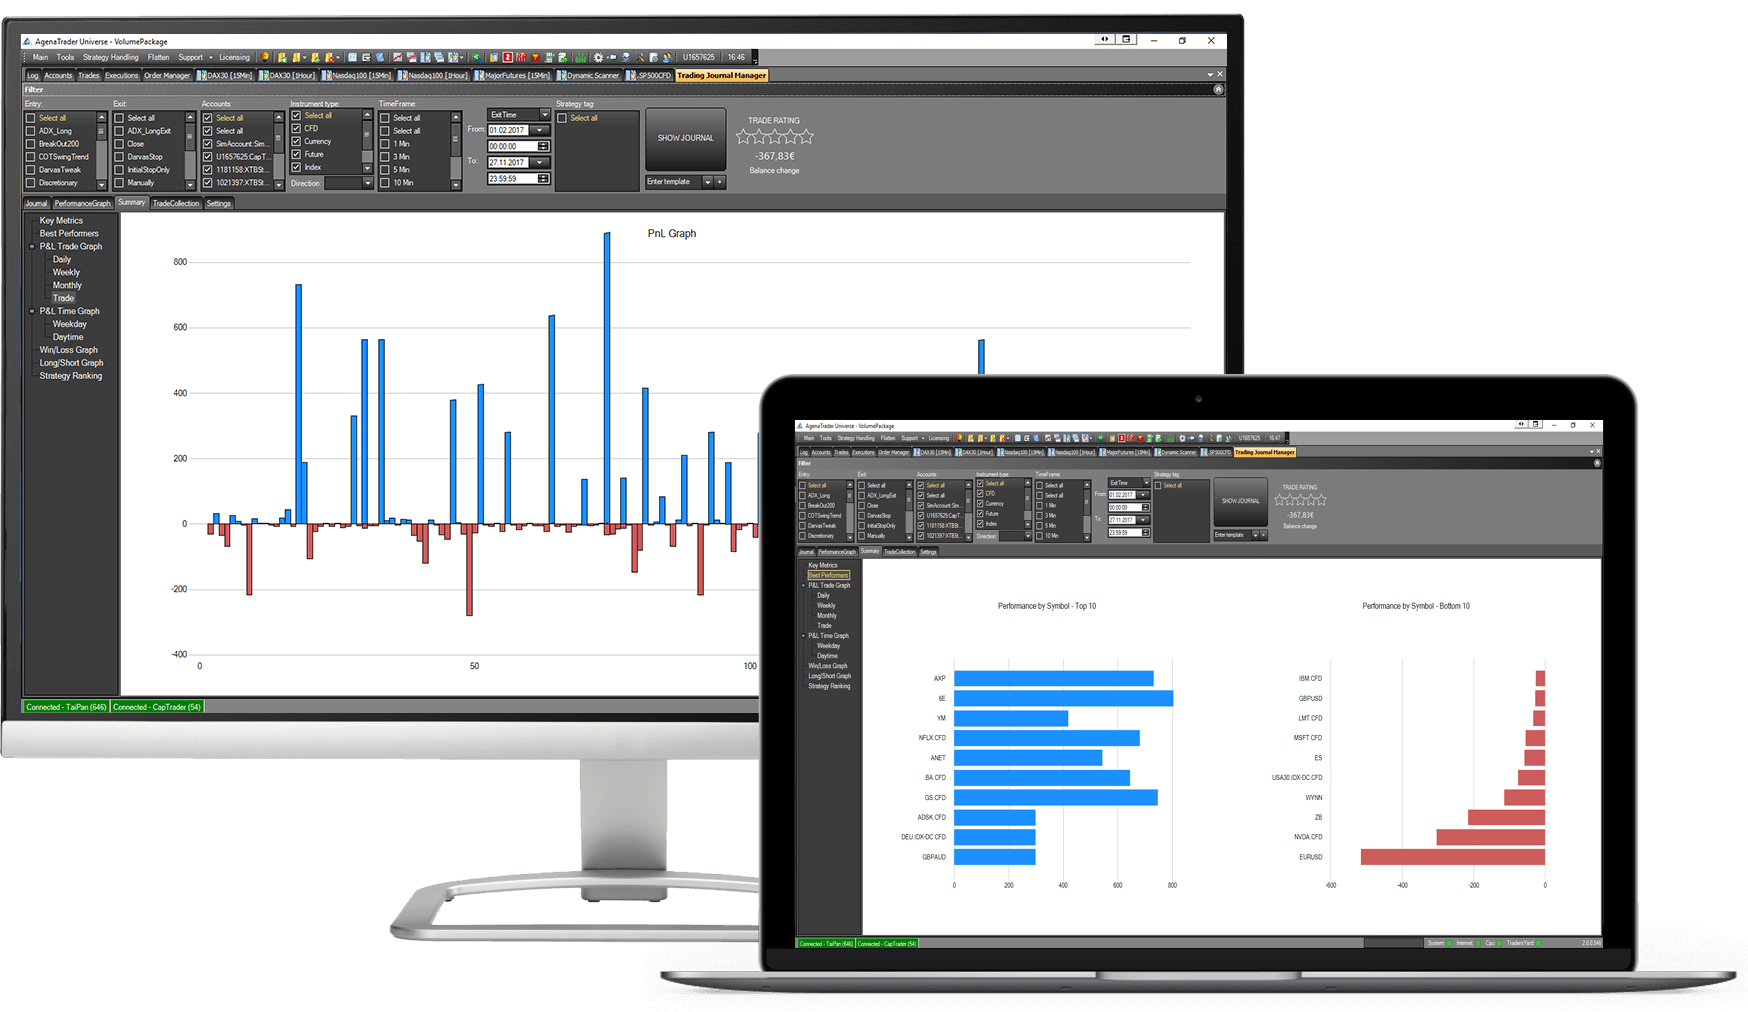
- In which instruments do you generate the highest profits?
- On which weekday and at which time of day do you generate the highest wins?
- Profit/loss per day/week/month or trade.
- Graphical preparation of your profit/loss ratio.
- Ranking of your traded strategies with regards to the respective P&L generated.
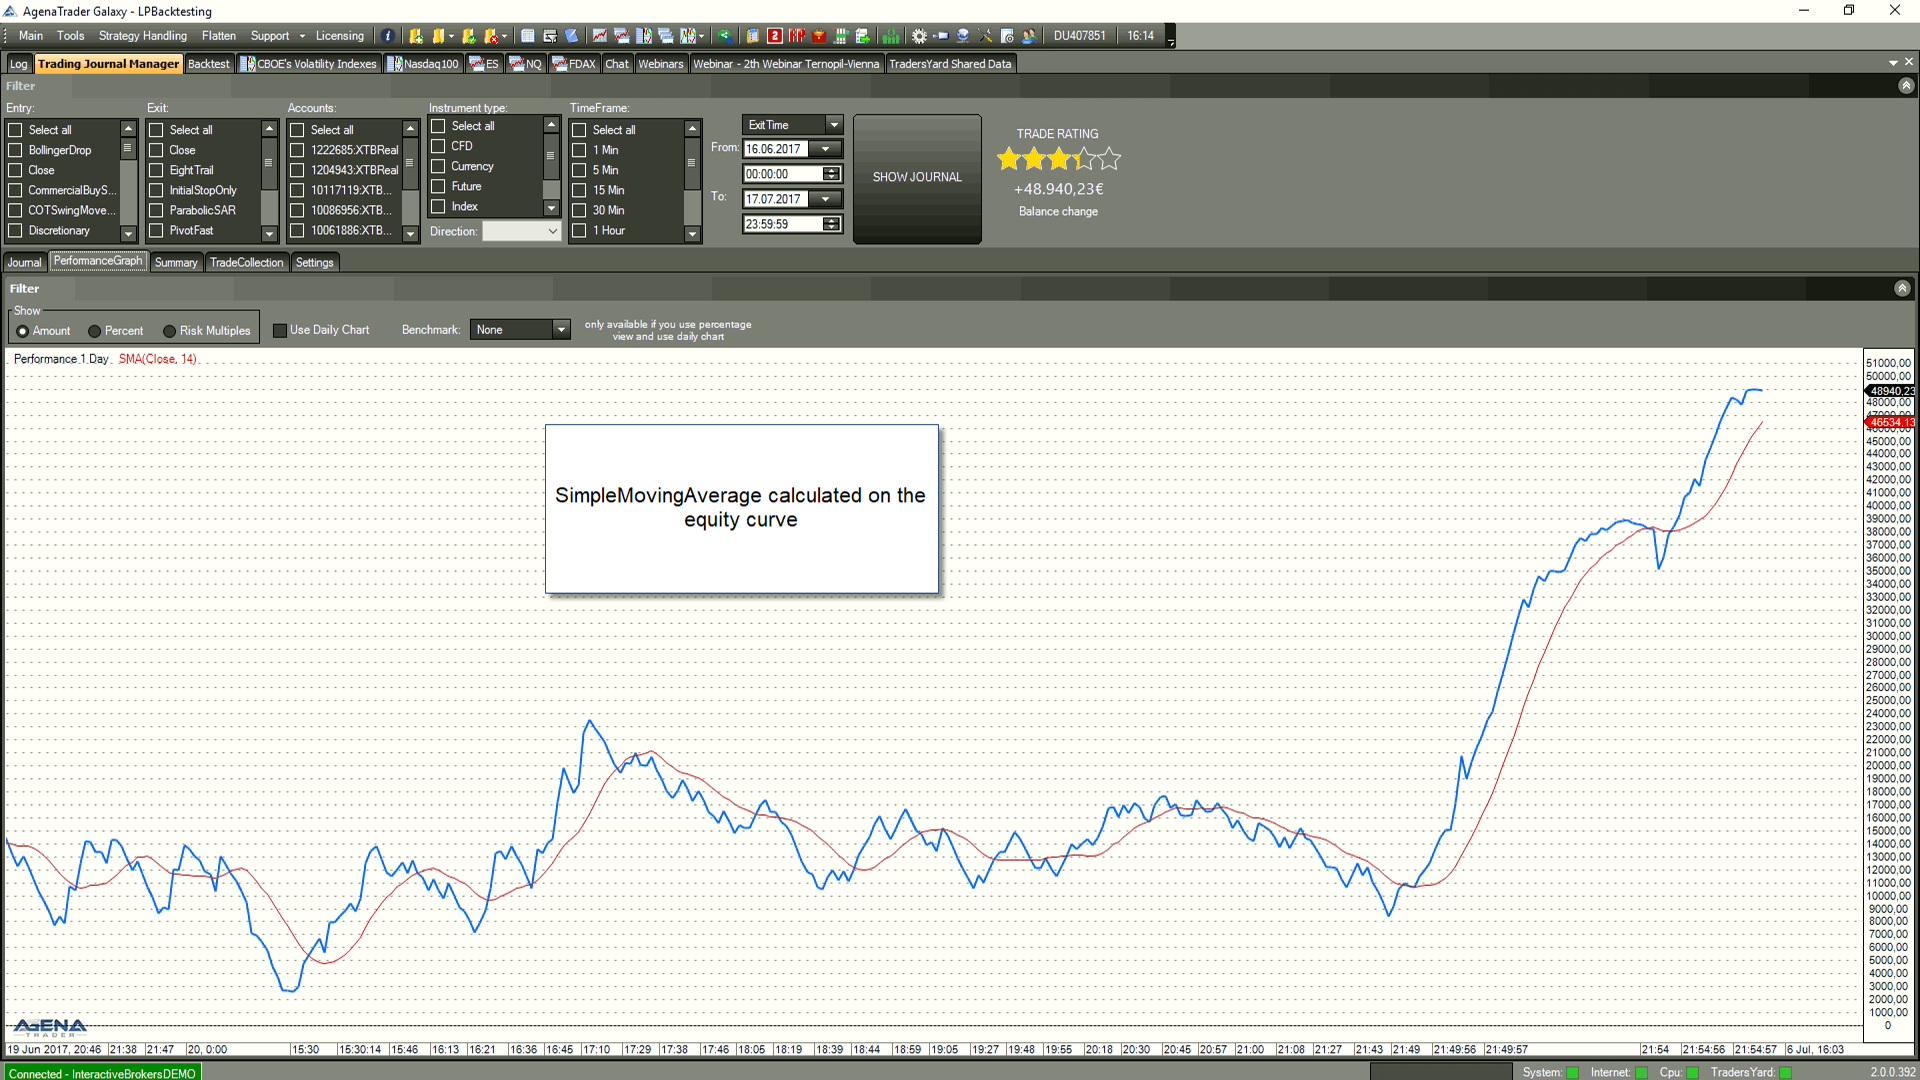
- Have your indicators calculated to your equity curve (enables manual equity trading!).
- Use drawing objects to analyze your equity curve.
- Calculation of risk multiples for your trades, plus graphical preparation
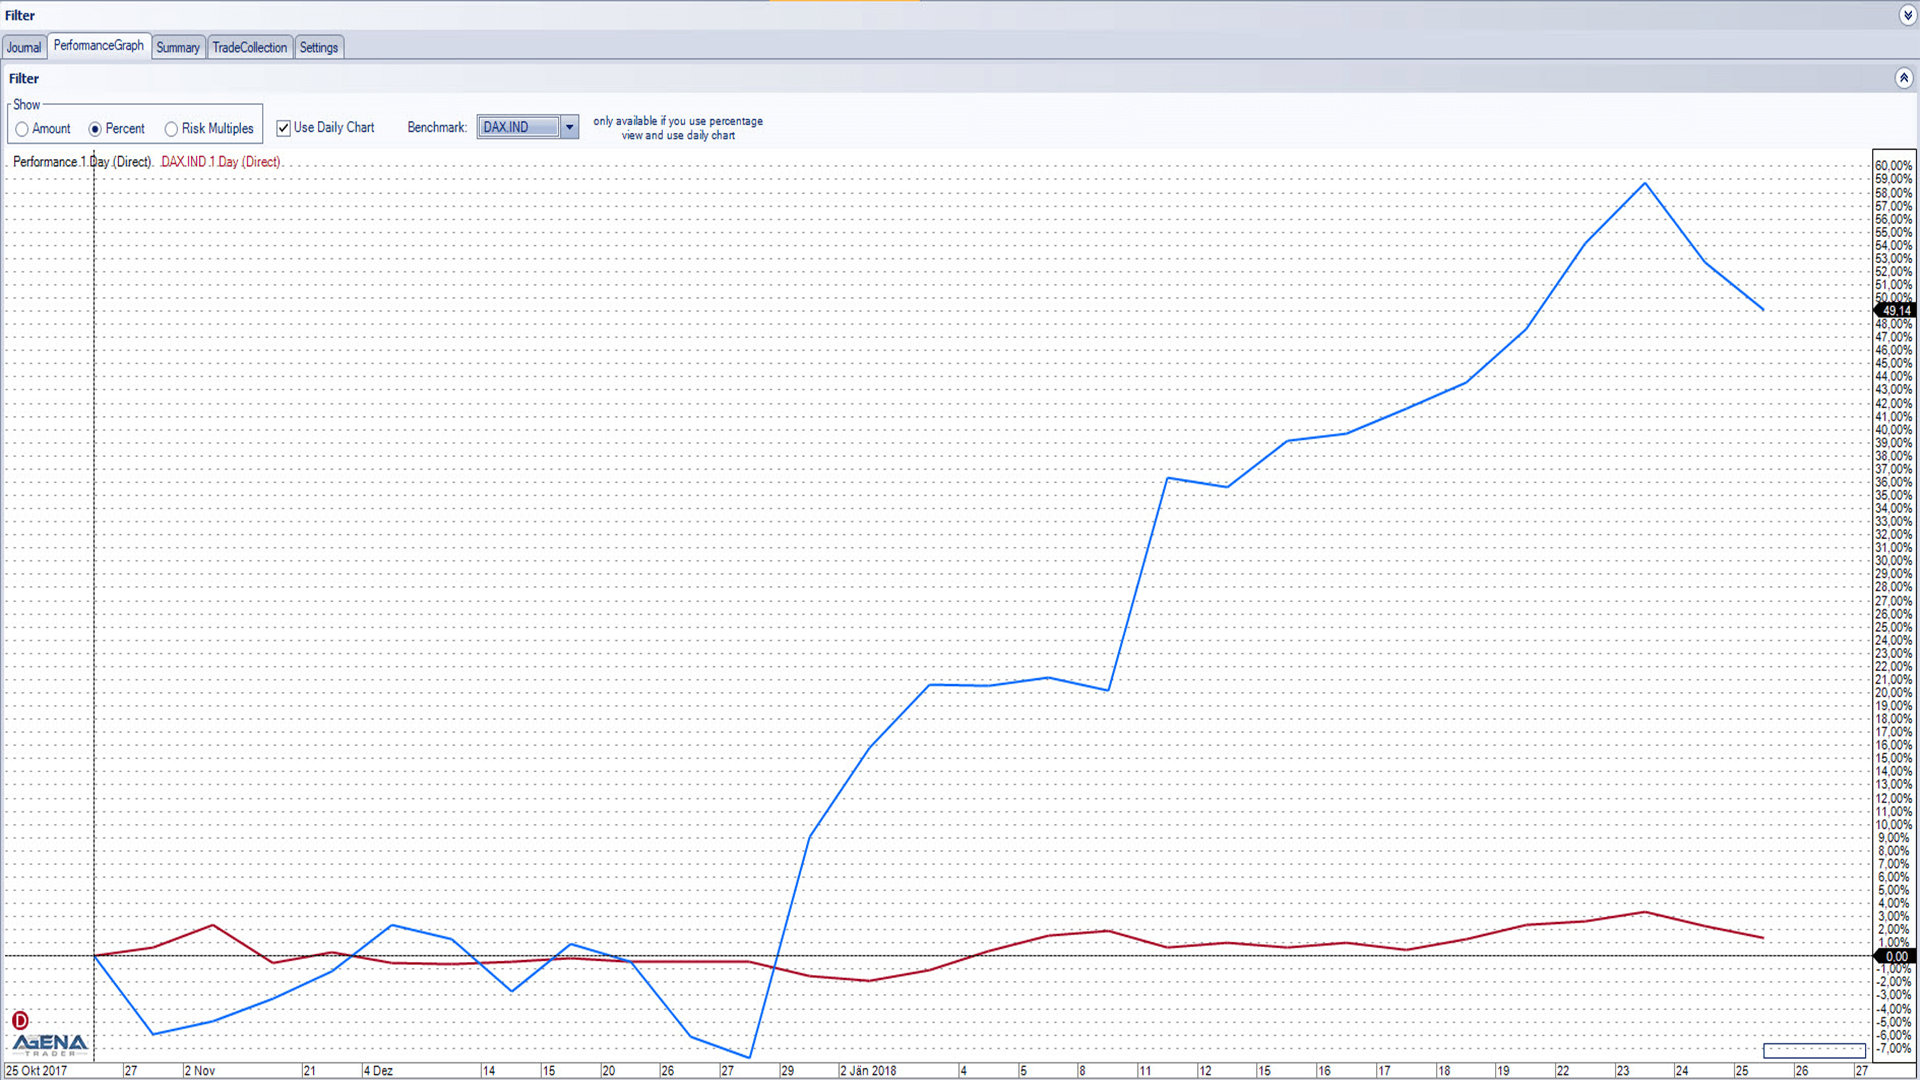
- Benchmarking: compare your trading results to an index (SP500, NQ100, DAX30 etc.) – can you beat the market with your trading?
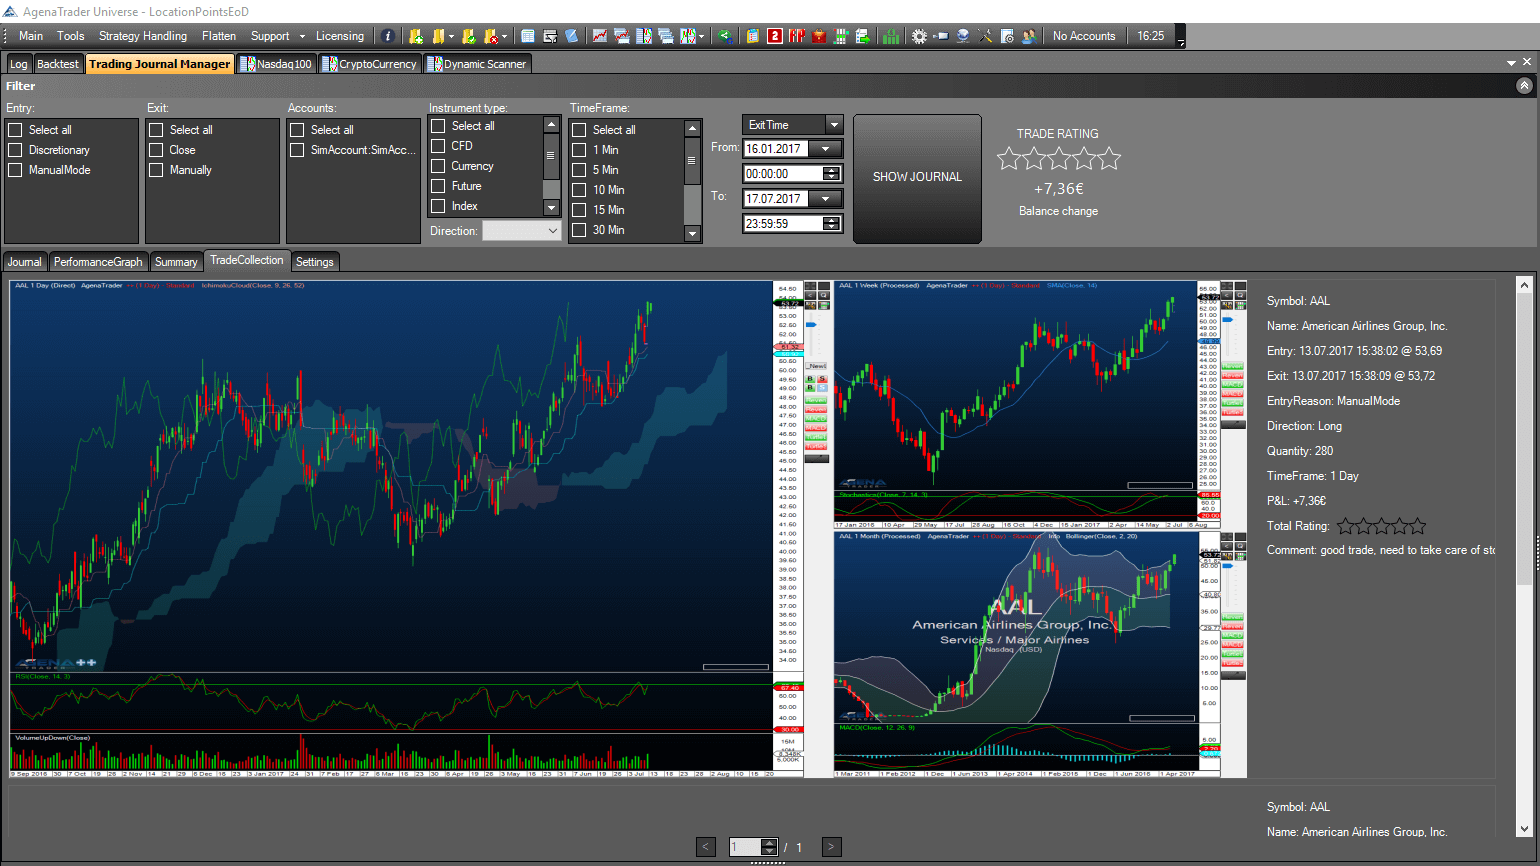
- Scroll through all your past trades in the Trade Collection, add comments and analyze your historical trades
With this add-in, you receive the following features:
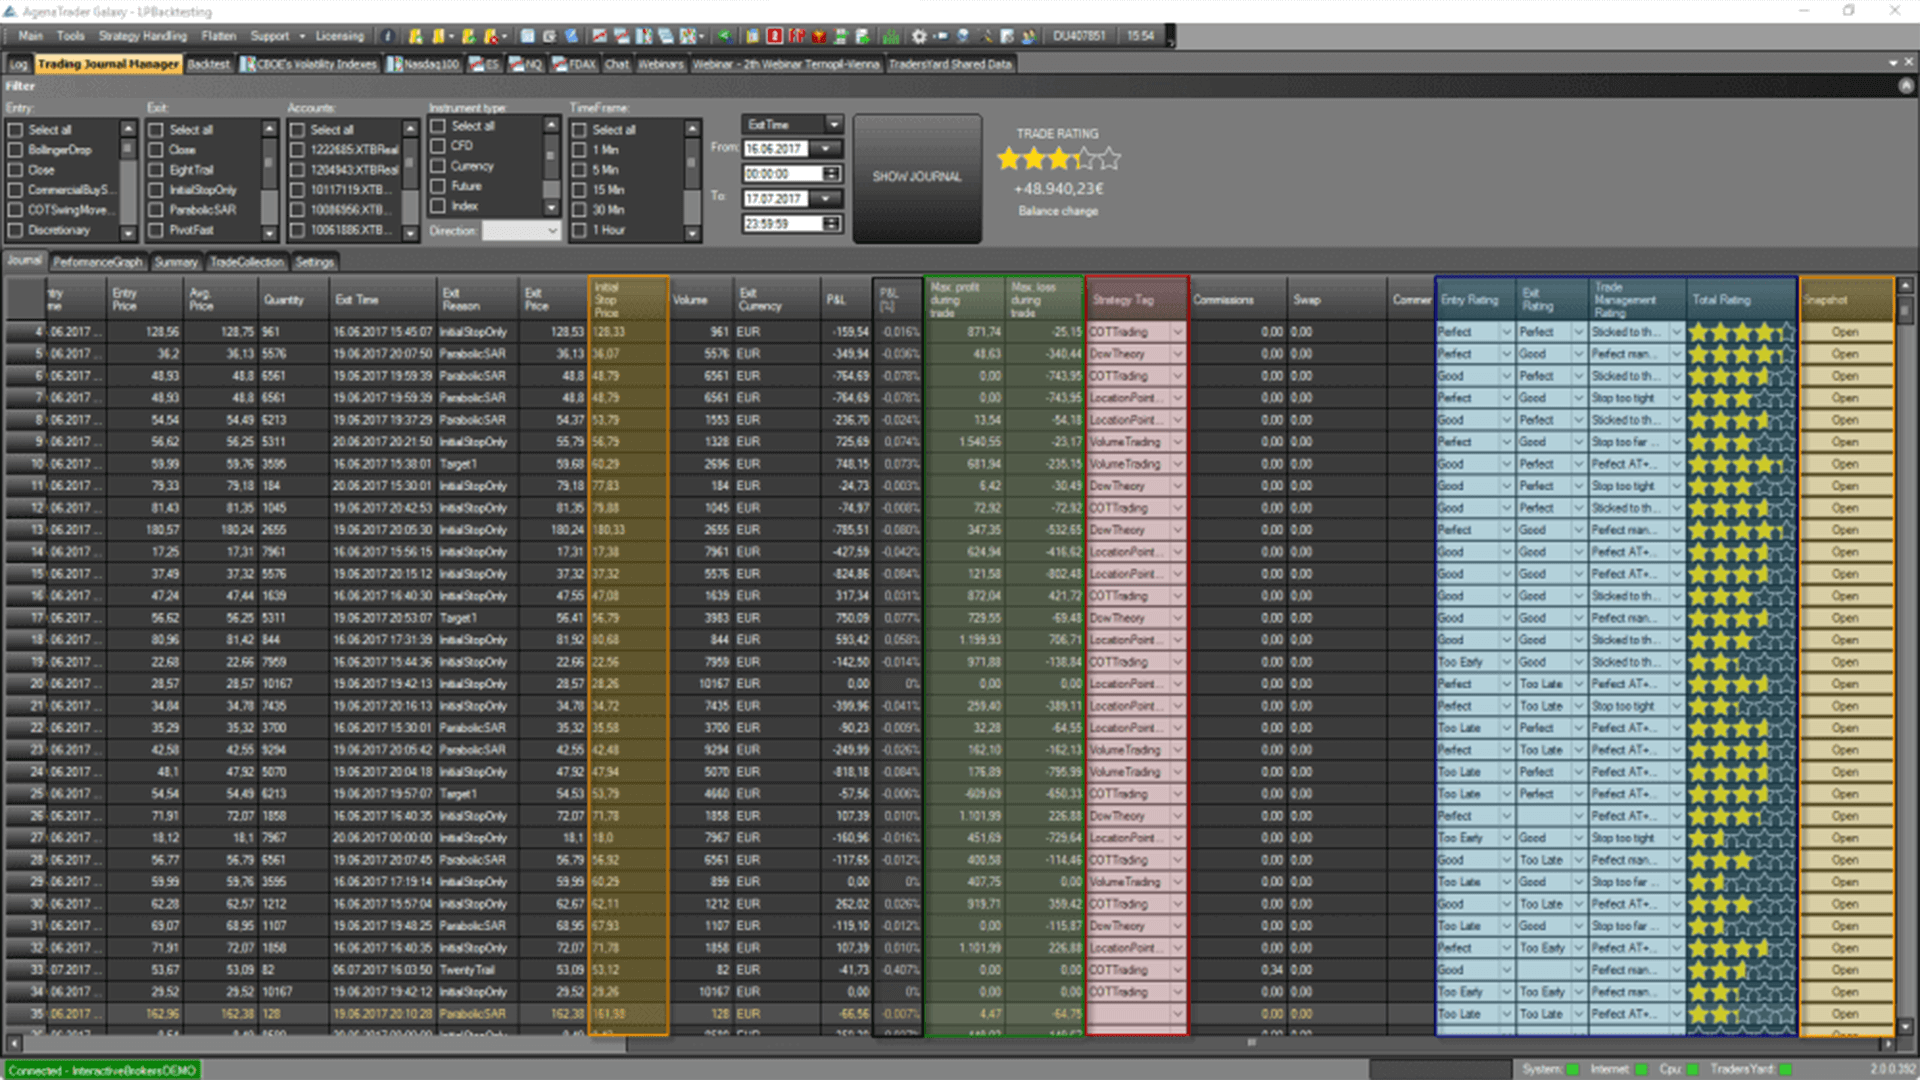
- professional and extremely extensive statistics
- graphic analyses and evaluations of all your trades
- use indicator calculation and drawing objects for your equity curve
- benchmark comparison of your trading to a market index
- representation of the risk multiples
- innovative view of all your historical trades by simply scrolling through the TradeCollection