ISIN: US92343E1029
VeriSign, Inc. is a software company that provides internet infrastructure services. The company ensures the reliability and accessibility of internet services. This includes domain name registrations, real-time name resolution for a series of top-level domains, escrow services and cloud-based network services for corporate customers. The VeriSign stocks have been traded on the NASDAQ since 1998, and belong to the S&P 500 index of the largest enterprises in the USA.
The following analysis will examine the stock of the company from a chart-related, technical point of view.
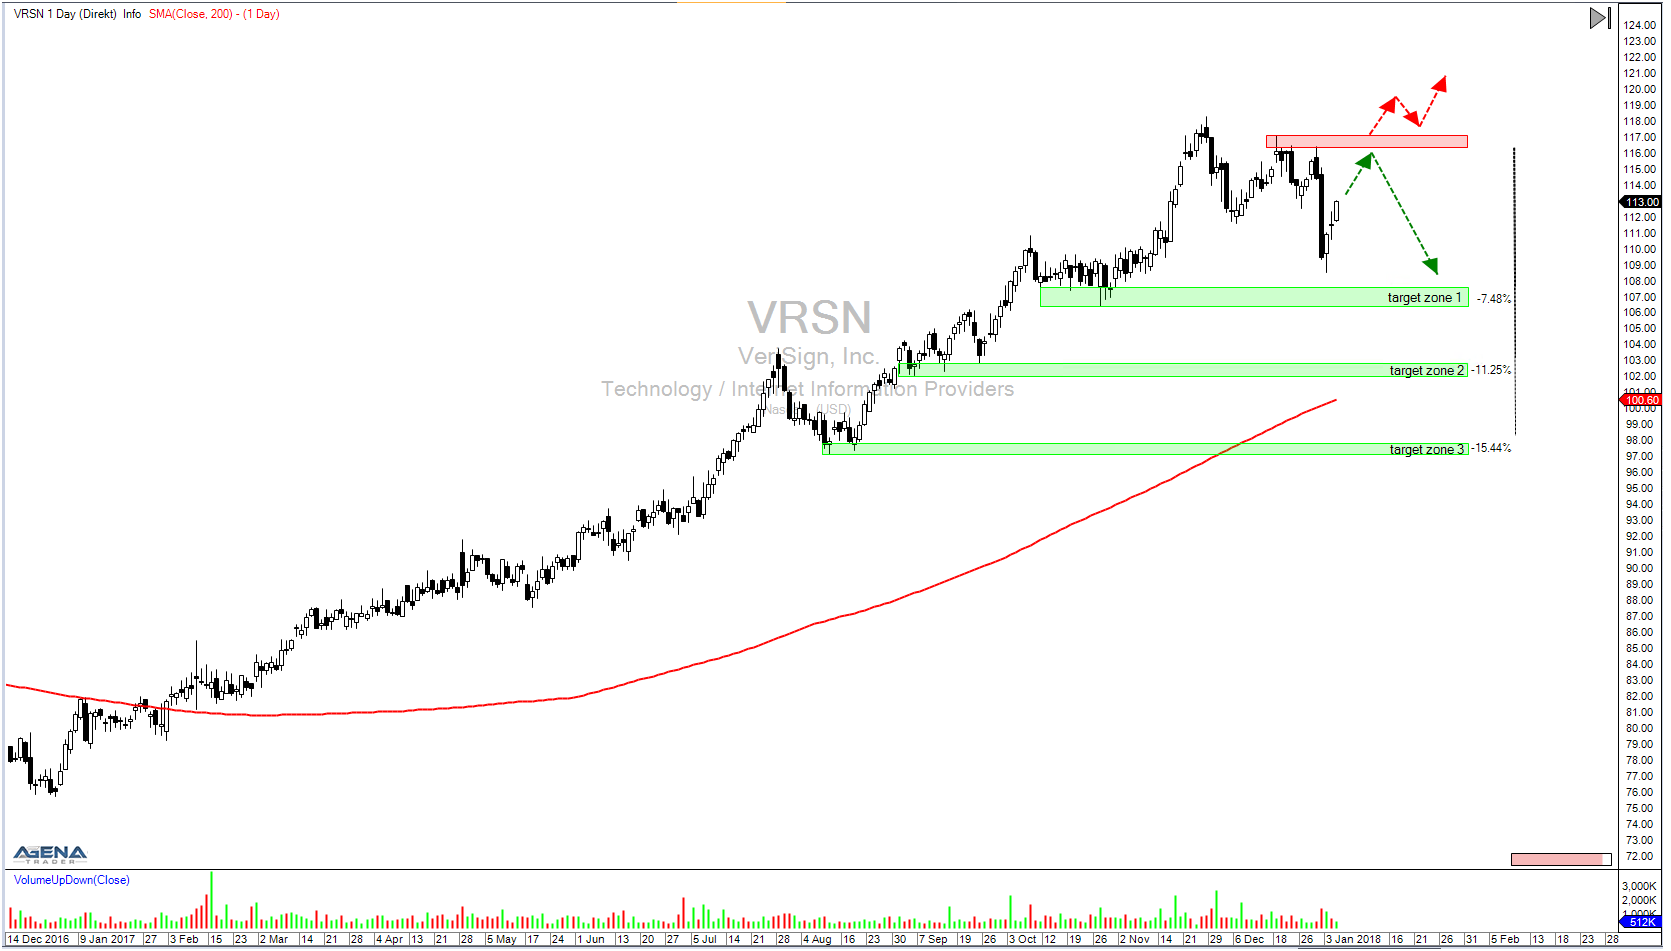
Review (daily chart)
After an impressive rally throughout the entire year 2017, more recently, a little more downward pressure entered the value. After being unable to reach any new highs in the trading weeks prior, this was followed by stronger sell-offs and presumably also profit-takings by the big market participants in the stock. Currently, a mid-term downward trend has formed, which after its last downward movement is now in a correction. As soon as this correction has come to an end, an entry in the short direction would be conceivable, especially since the targets in this value are attractive and there is plenty of downwards potential.
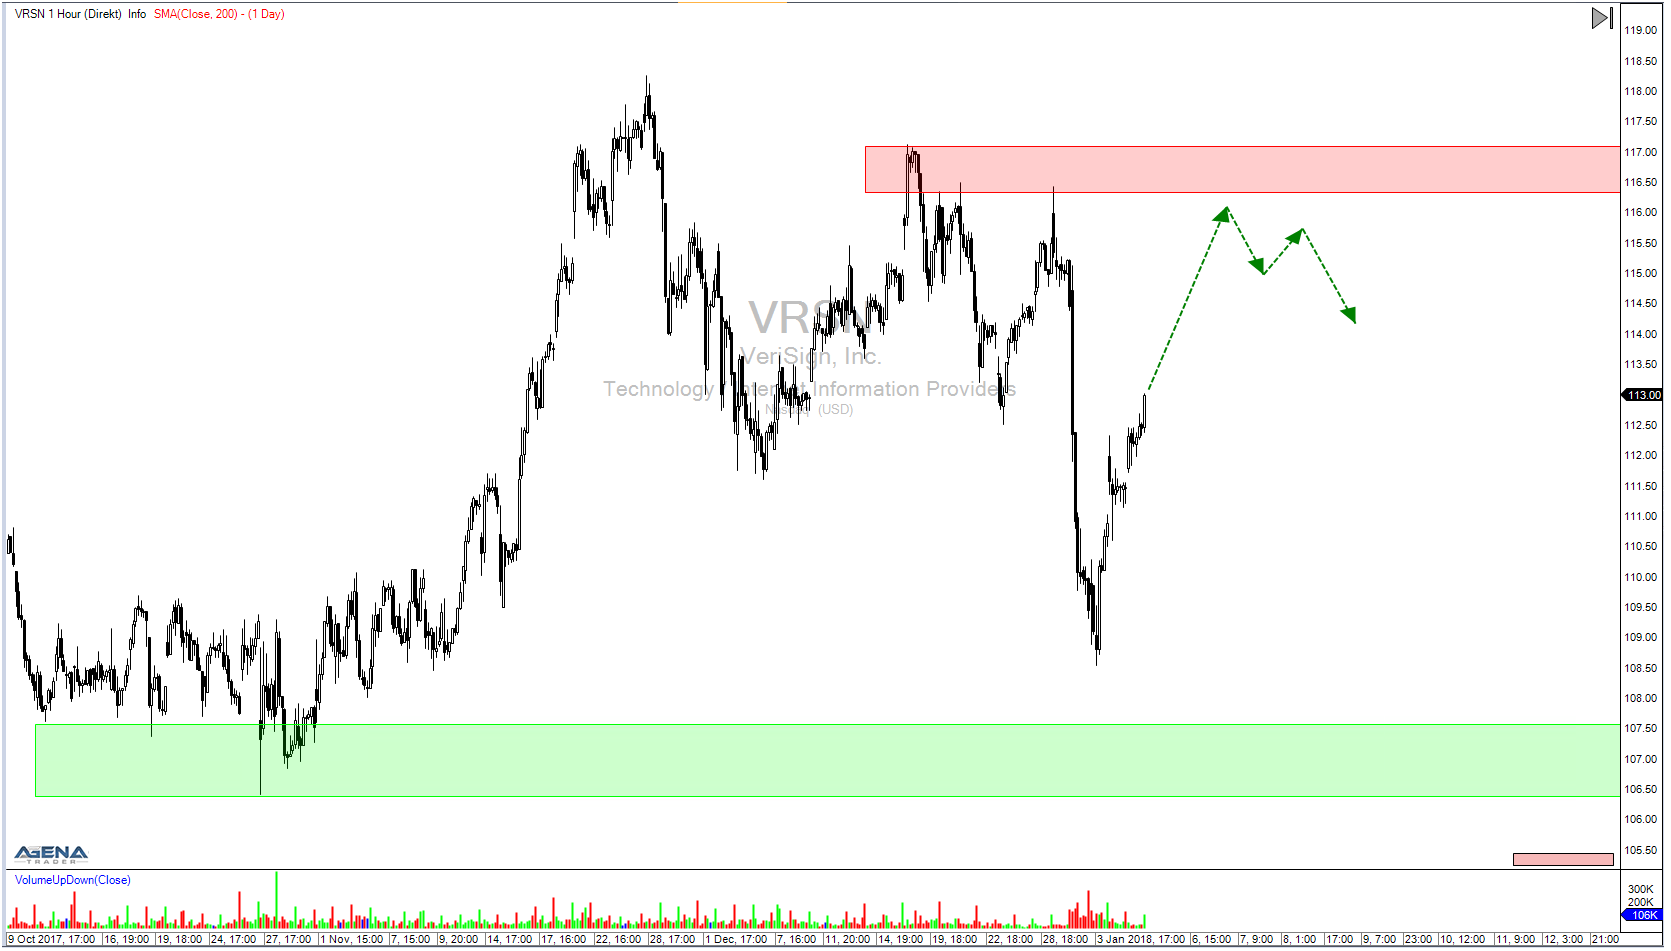
Outlook (hourly chart)
In the hourly chart, we can see the correction that is currently underway and which has yet to develop in our preferred trading direction.
For a short entry, we should wait for the formation of a signal, e.g. in the form of a P2, and place the stop loss above the last P3 (depicted in green).
Alternatively, and with the advantage of a more favorable stop, one can also practice trading from out of the correction or the formation of a reversal bar at a significant point.
The first target is located in the area around $108.00 (see green zone in the daily chart). A continuation of the trend to form further lows is definitely possible.
If the price considerably exceeds the last significant high at $117.20, the short scenario should be abandoned for the time being (see red zone in the daily chart).
Before trading, one should take news in the environment and from the company into account.
Similarly, one should also observe the development of the overall market.
Disclosure of possible conflicts of interest: at the time of publishing this analysis, the author is not invested in the securities or underlyings discussed.
DISCLAIMER
Exchange transactions are associated with significant risks. Those who trade on the financial and commodity markets must familiarize themselves with these risks. Possible analyses, techniques and methods presented here are not an invitation to trade on the financial and commodity markets. They serve only for illustration, further education, and information purposes, and do not constitute investment advice or personal recommendations in any way. They are intended only to facilitate the customer’s investment decision, and do not replace the advice of an investor or specific investment advice. The customer trades completely at his or her own risk. It is expressly advised to observe our usage regulations and risk information, available under the link Legal Information on this internet page.
Leave A Comment
You must be logged in to post a comment.