
AgenaTrader Beta Release 2.9.1 coming soon
After V2.9.0 just was released as a broker specific version for a limited amount of users, AgenaTrader version V2.9.1 as a major Version will come soon.
Here is a small list of what you can expect.
-
Features:
- Final Option Features (for more info, please visit our shop)
- Introduced hard-disk health indicator to help raise performance awareness of local machine
- New feature: Signal Trades Analysis Broadcasting:
The integration of AgenaTrader with TradersYard has been improved and simplified.
It is now much easier to share chart analyses and also trades from the ActionBar or from the scanner.
If you want to share only one chart analysis/trade suggestion, you will find the icons with the share symbol in the action bar.
From the scanner, you can share several analyses/trades at the same time by dragging and dropping the instrument symbols from the scanner to the
symbol list of the popup or by entering them there manually.
Also, the popup for entering the analysis text has been made more user-friendly with which you can now also format the text better. -
Improvements
- AutoReloadHistory // Improved logic for automatic reload of historical data
- Chart // Improved visibility so OrderBar ensures visibility of order’s quantity value
- FinancialCalendar // Countries now can be selected when checking holidays
- FuturesCalendar // Improved logic for alerting and rollover of a futures instrument
- IB // Further improvements are conducted in order to capture more accurate real-time data for OHLC candle values
- IQFeed //Three-minute candles are now directly retrieved from datafeed (they are not processed locally anymore)
- LocationPoint // Performance tweaks
- OrderStream // Labels added to OrderStream statistics
- CQG // Added the possibility to use both FrontMonth and Continuous futures contracts (can be set in Connection Options and Instrument Escort)
- Drawings // Added Fibonacci Retracements for logarithmic charts
- Dukascopy // Client messages are now translated into AgenaTrader messages
- FuturesCalendar // Implemented “Move all futures to actual expiry” functionality
- IB // Optimized communication traffic between AgenaTrader and TWS
- Indicators // Added IchimokuCloud for logarithmic calculation
- MT5 // Sector and industry details of each instrument are now retrieved from MT5 brokers and shown in AgenaTrader (in the assumption that they are originally defined in MT5)
- Packages // Improved logic of importing Packages which the same instrument lists as local machine
And a lot of Performance and Security-Updates.
You are not the first to use this beta version. Several hundred users are already using it.
You can download 2.9.1 from here…..
Goersch Trend Setups
The ultimate solution for all short to medium term trend traders
Forget about complicated trend analyses, combinations of different time frames and complex evaluations of different trend strengths. The Goersch Trend Setups AddOn simply takes all this tedious work off your hands.
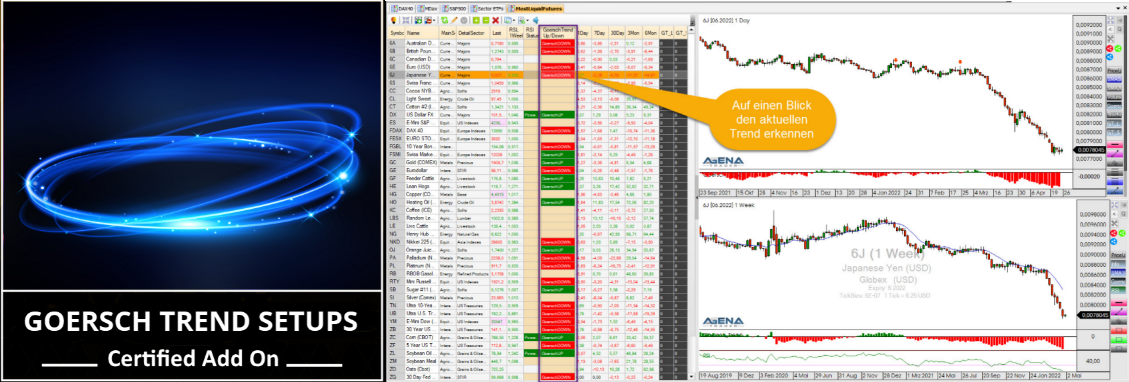
The Goersch Trend Indicator is a very popular trend indicator that uses the past price movement to indicate the trend as well as the trend strength of the current movement. The indicator can be used for all underlyings and time frames. The special feature is that it is extremely easy to interpret and works “out-of-the-box”. The calculation automatically adjusts to the displayed time frame. Thus, an interpretation is always the same – whether you are looking at a stock, a currency, an index or a commodity. Regardless of whether you are working in the 5-minute, hourly, daily or even weekly chart. It is very easy to determine whether an underlying is moving in a trend, whether this trend strength is currently increasing (i.e. stable) or decreasing (i.e. the trend is weakening), or whether the trend is about to tip. The indicator shows you this important information at a glance.
However, the heart of the Goersch Trend Setups AddOn is the ready-made professional workspace, in which the current trading signals from the daily chart are displayed directly. You can define the basket of underlyings that you screen for setups fully automatically. Whether the stocks of the S&P 500 are searched for signals, the Stoxx 600 or the most liquid futures. The current long and short setups are always displayed on a daily basis in the corresponding underlyings. This way you will never miss a trade and all your positions are automatically in the direction of the overriding trend. An ideal trading approach for traders with a nine-to-five job and all traders who don’t want to spend the whole day in front of the charts.
Please read the documentation here….
Find the product in our shop…

Upcoming Events
June 08, 2022 6:00PM — Mario Lüddemann — Small account trade big @CapTrader — Register now
June 08, 2022 6:30PM— Ruediger Born — Born Academy @BNP Paribas — Register now
June 08, 2022 7:00PM — Carsten Berger — Index Analysis with the Pearl Diver method @FXFlat — Register now
June 14, 2022 6:00PM — Marcus Ruhnau and Carsten Berger — Trading with Stocks and Options @CapTrader — Register now
June 15, 20226:30PM — Ruediger Born — Born Academy @BNP Paribas — Register now
June 21, 2022 6:00PM — Marcus Ruhnau and Carsten Berger — Trading with Stocks and Options @CapTrader — Register now
June 22, 2022 7:00PM — Carsten Berger — Index Analysis with the Pearl Diver method @CapTrader — Register now
June 22, 2022 6:30PM — Ruediger Born — Born Academy @BNP Paribas — Register now
June 28, 2022 6:00PM — Marcus Ruhnau and Carsten Berger — Trading with Stocks and Options @CapTrader — Register now
June 29, 2022 7:00PM — Carsten Berger — AgenaTrader Helpdesk @FXFlat — Register now
July 06, 2022 6:00PM — Gilbert Kreuzthaler – AgenaTrader Insights – Which features simplify my trading — Register now
Tip of the week: Chart templates
Did you know that in the AgenaTrader you have chart templates available that allow you to open individually created templates fast and easily?
To save a specific chart as a template, just click on the respective icon in the ChartToolBar, choose „Save“, type the name in to the now open input window and confirm with „OK“. In case you want to save this specific template as a default template, just choose „Save as default“ instead of „Save“.
When you want to open a saved template, just click on the icon in the ChartToolBar, then click on „Load“ and choose the desired template. You can also save and open chart templates by right clicking into the chart and then choosin „Settings -> Chart templates -> …“ in the now open context menu.
Watch this webinar (in German language) about templates or find detailed instructions here in our Online Help.
Leave A Comment
You must be logged in to post a comment.